Overview
Monitoring is a critical part of any cloud infrastructure and it is important to maintain reliability, availability, and performance of your AWS cloud applications. There are 2 main types of monitoring you can do on AWS EC2 Instances as follows
- Basic Monitoring for Amazon EC2 instances: Seven pre-selected metrics at five-minute frequency and three status check metrics at one-minute frequency, for no additional charge.
- Detailed Monitoring for Amazon EC2 instances: All metrics available to Basic Monitoring at one-minute frequency, for an additional charge. Instances with Detailed Monitoring enabled allows data aggregation by Amazon EC2 AMI ID and instance type.
While limited monitoring is enabled by default, it does not cover the memory utilization or disk I/O of the instances, for these use cases you need to enable custom monitoring on EC2 instances.
This post covers how to enable custom detail monitoring and collect memory and disk metrics using AWS CloudWatch agent, later you can build custom CloudWatch dashboards using these metrics.
Note: You can also monitor EC2 instances using older Perl scripts click here for more info
In summary, you need to do the following:
- Create CloudWatch Role
- Assign CloudWatch Role to EC2 Instance
- Install CloudWatch agent on the EC2 Instance
- Configure Metrics
- Start CloudWatch agent
- Create CloudWatch Dashboards
Following are the details of the above steps
Create CloudWatch Role
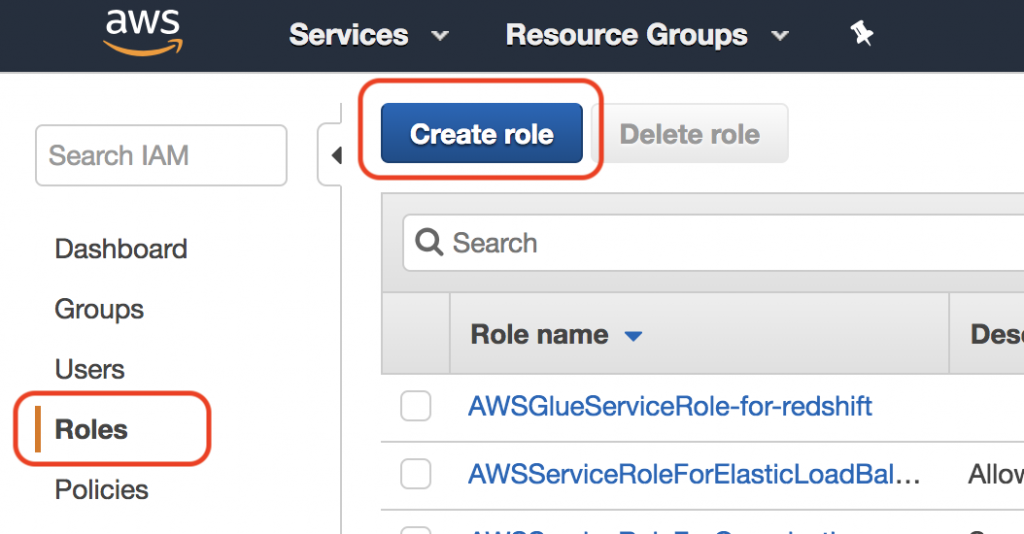
Log in to AWS console and select Services > IAM or Search IAM
Click Role in the left panel and click Create Role button
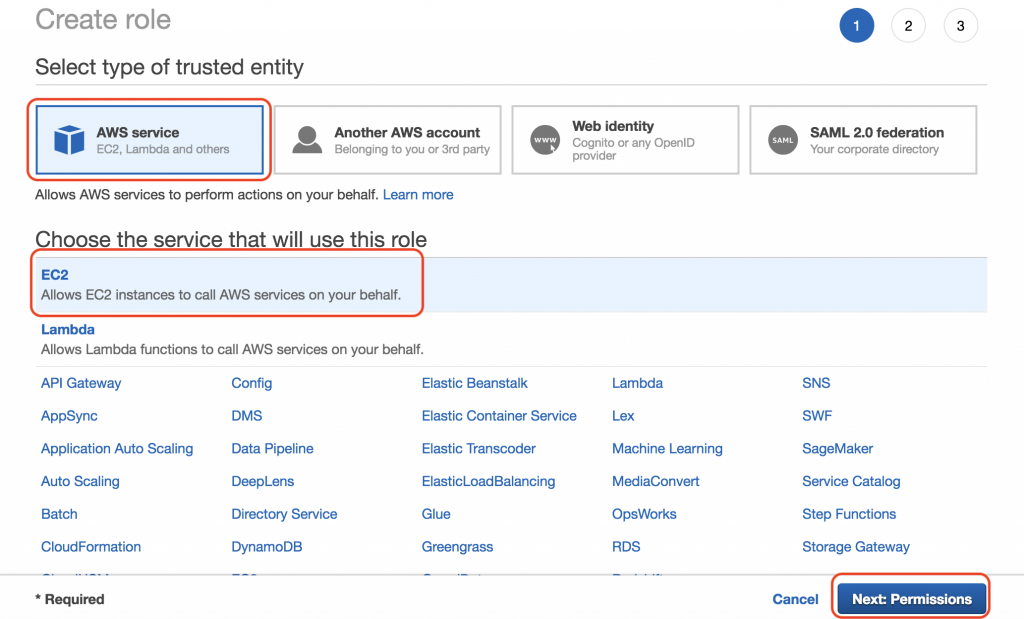
Select AWS Service, EC2, and Next: Permissions button
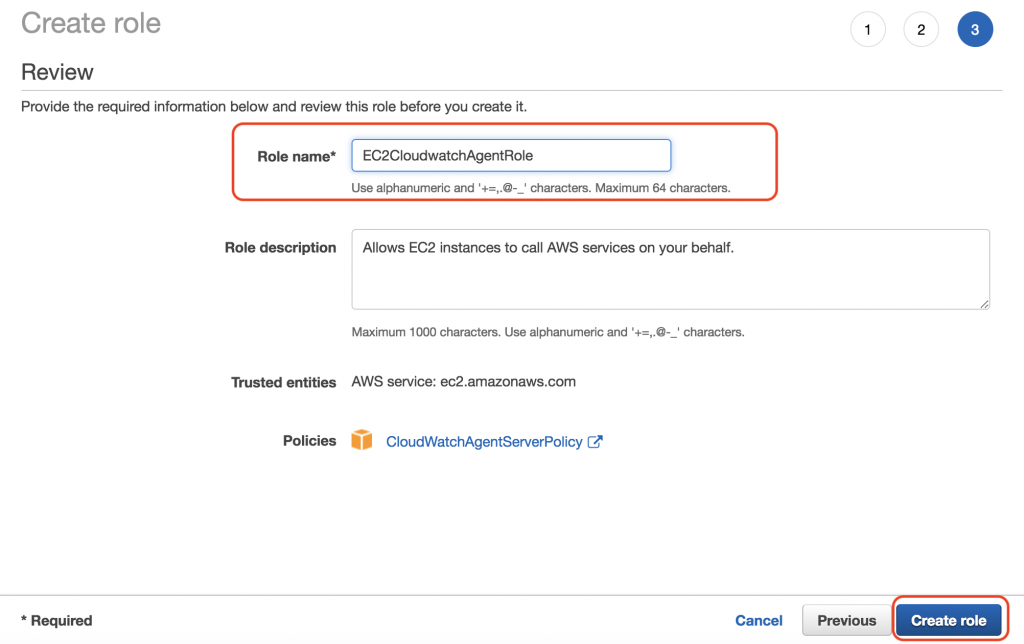
Search for cloudwatch and check CloudWatchAgentServerPolicy and click Review
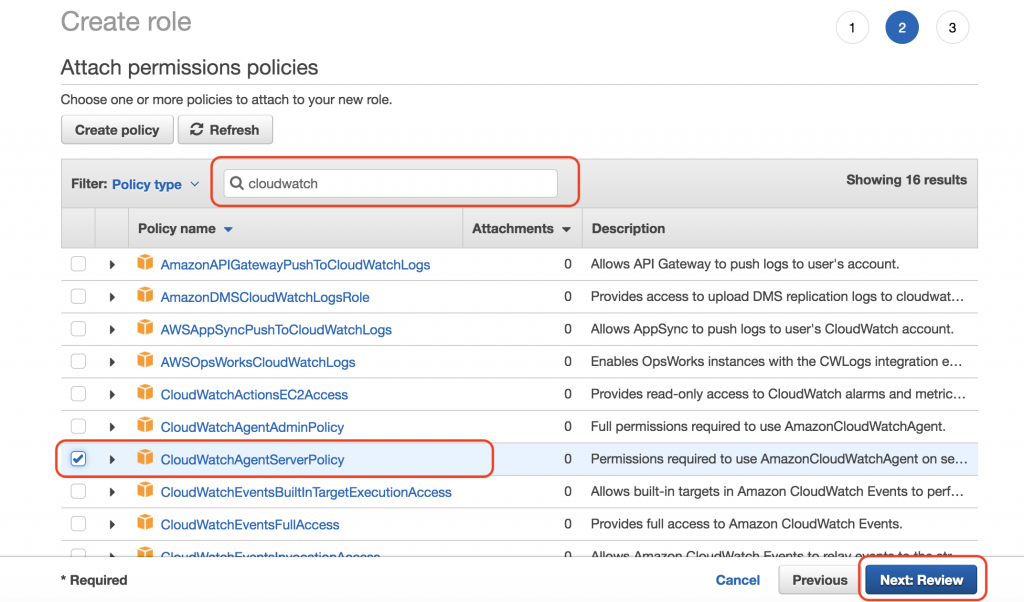
Name your role such as EC2CloudWatchAgentRole and click Create role
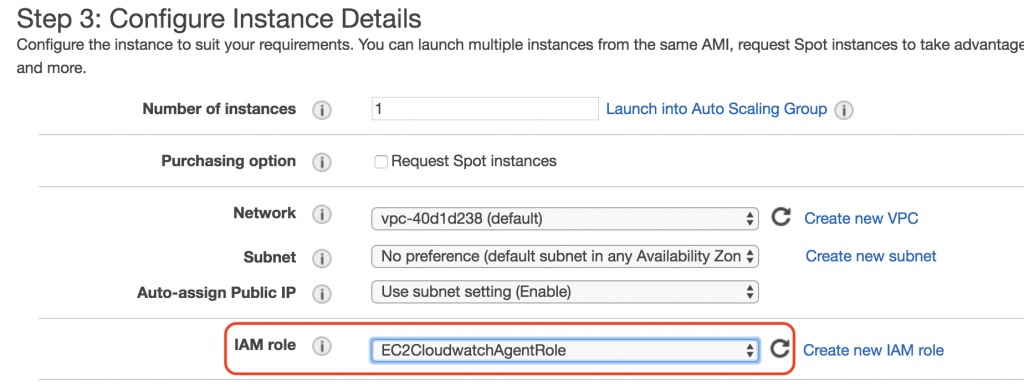
Assign CloudWatch Role to EC2 Instance
When launching EC2 Instance, simply select the IAM Role that we have created in the previous step as shown in the slide
Install CloudWatch Agent
There are others ways to install CloudWatch agent, in this post we will cover the manual process.
You can download and install CloudWatch agent using the following commands on Linux (for Windows see AWS Docs)
$ cd /tmp
$ wget https://s3.amazonaws.com/amazoncloudwatch-agent/linux/amd64/latest/AmazonCloudWatchAgent.zip
$ unzip AmazonCloudWatchAgent.zip
$ sudo ./install.sh
Configure Metrics
Configuring metrics is important, this step describes the metrics you want to collect and send to CloudWatch, AWS CloudWatch agent read that info from a JSON file, the simplest way to create this file is to run the following command
$ sudo /opt/aws/amazon-cloudwatch-agent/bin/amazon-cloudwatch-agent-config-wizard
The above command would ask series of questions and generate the configuration file at the following location
The config file is usually located at /opt/aws/amazon-cloudwatch-agent/bin/config.json
To learn more about configuration file click here
Start CloudWatch Agent
Execute the following command to start the CloudWatch agent, make sure you replace the file: path with your location of the configuration file
$ sudo /opt/aws/amazon-cloudwatch-agent/bin/amazon-cloudwatch-agent-ctl -a fetch-config -m ec2 -c file:/opt/aws/amazon-cloudwatch-agent/bin/config.json -s
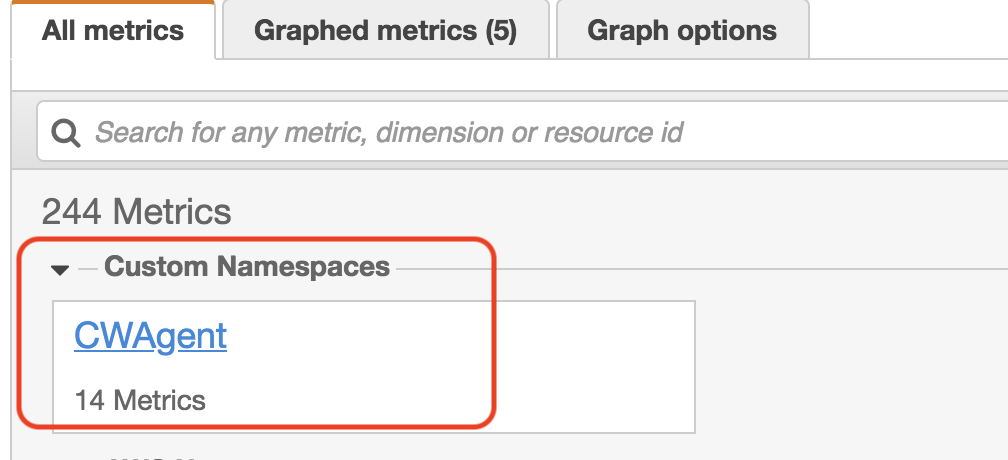
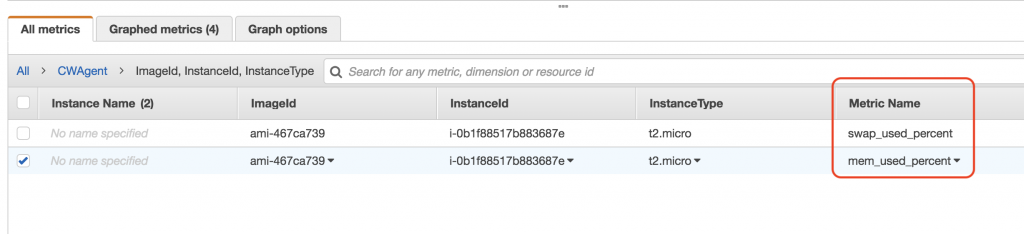
Create CloudWatch Dashboard
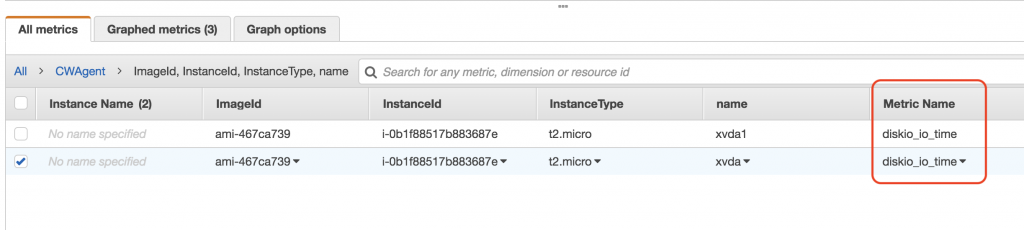
Once the agent is started you would see the CWAgent in CloudWatch console when creating dashboards, clicking on the agent would provide you various detailed level metrics such as CPU, memory, and disk as shown in the slides.
Hope you find this post useful, please leave a comment and share your thoughts.
For more info or troubleshooting check AWS docs
About DataNext
DataNext Solutions is US based system integrator, specialized in Cloud, Big Data, DevOps technologies. As a registered AWS partner, our services comprise of any Cloud Migration, Cost optimization, Integration, Security and Managed Services. Click here and Book Free assessment call with our experts today or visit our website www.datanextsolutions.com for more info.